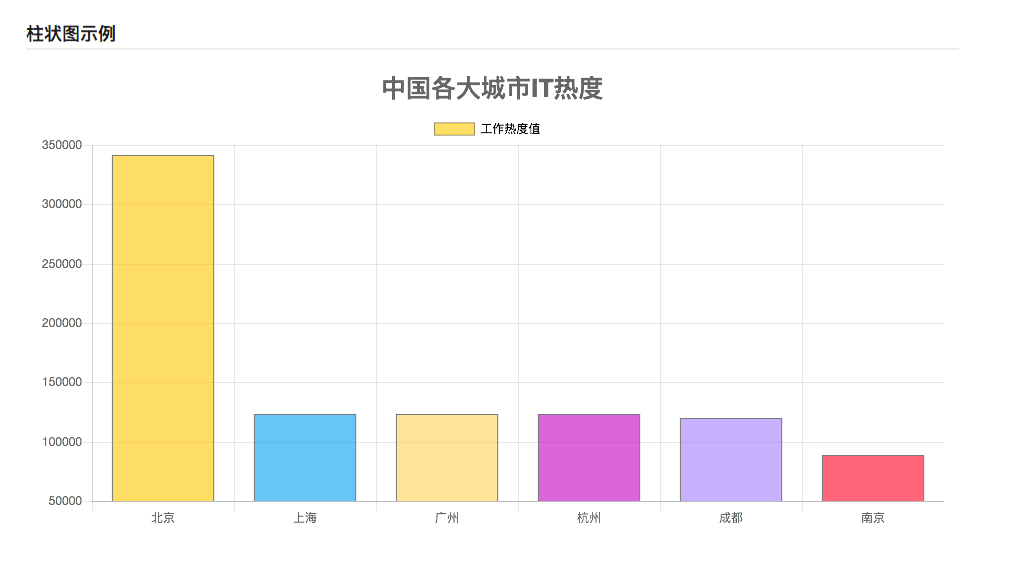
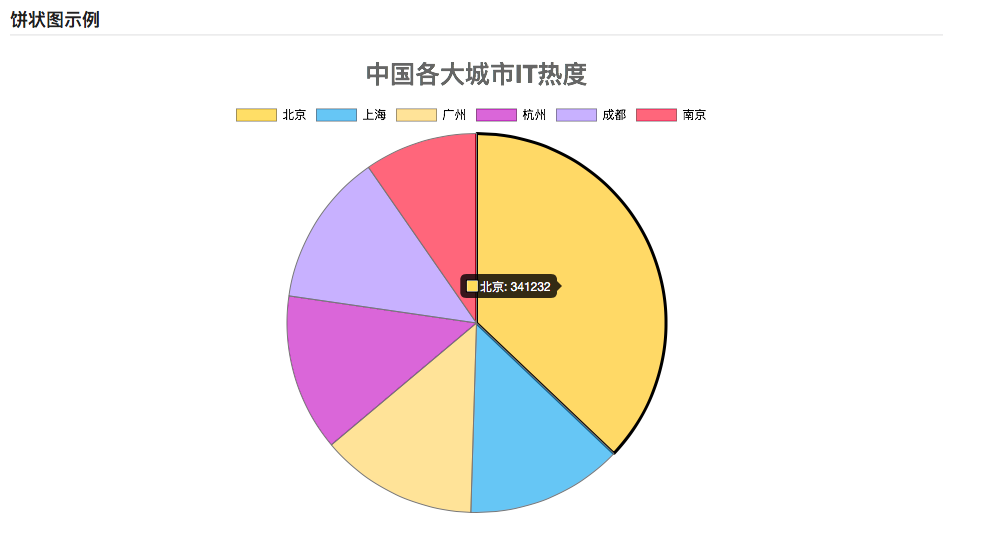
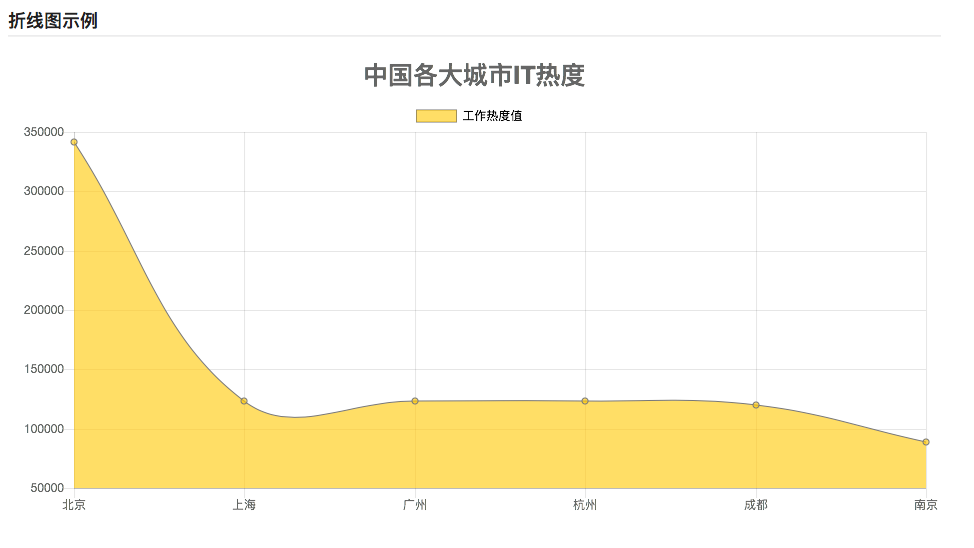
一起学Chart.js 发表于 2017-09-29 Chart.js作图再好不过了. 一个图表控件集合,使用html5的canvas进行绘制。 先看效果图咯 上代码12345678910111213141516171819202122232425262728293031323334353637383940414243444546474849505152535455565758596061626364656667686970<!DOCTYPE html><html lang="en"><head> <meta charset="UTF-8"> <meta name="viewport" content="width=device-width, initial-scale=1.0"> <meta http-equiv="X-UA-Compatible" content="ie=edge"> <title>chartjs示例</title> <link href="https://cdn.bootcss.com/semantic-ui/2.2.13/semantic.min.css" rel="stylesheet"> <script src="https://cdn.bootcss.com/Chart.js/2.7.0/Chart.min.js"></script></head><body> <div class="ui container"> <div class="ui dividing header">饼状图示例</div> <canvas id="myChart"></canvas> </div> <script> let ctx = document.getElementById('myChart').getContext('2d'); <!-- 实例化Chart对象 --> let chart = new Chart(ctx, { type: 'pie', // pie饼状图, line:折线图, bar柱状图 data: { labels: ['北京', '上海', '广州', '杭州', '成都', '南京'], datasets: [{ label: "工作热度值", data: [341232, 123123, 123324, 123324, 120123, 88812], backgroundColor: [ 'rgba(255, 199, 32, 0.6)', 'rgba(54, 162, 235, 0.6)', 'rgba(255, 206, 96, 0.6)', 'rgba(175, 12, 192, 0.6)', 'rgba(153, 142, 255, 0.6)', 'rgba(255, 51, 64, 0.6)' ], borderWidth: 1, borderColor: '#777', hoverBorderWidth: 3, hoverBorderColor: '#000' }], }, options: { title: { display: true, text: "中国各大城市IT热度", fontSize: 25 }, legend: { display: true, position: 'top', labels: { fontColor: '#000' }, onClick: function() { alert("点我干嘛, dottie"); } }, layout: { padding: { left: 10, right: 10 } }, tooltips: { enable: false } } }) </script></body></html> 写的例子很简单, 当然也得益于前辈们对该框架封装好! 具体想深入学习的伙伴们可以去看官方文档哈, 传送门chart.js 😜😜😜